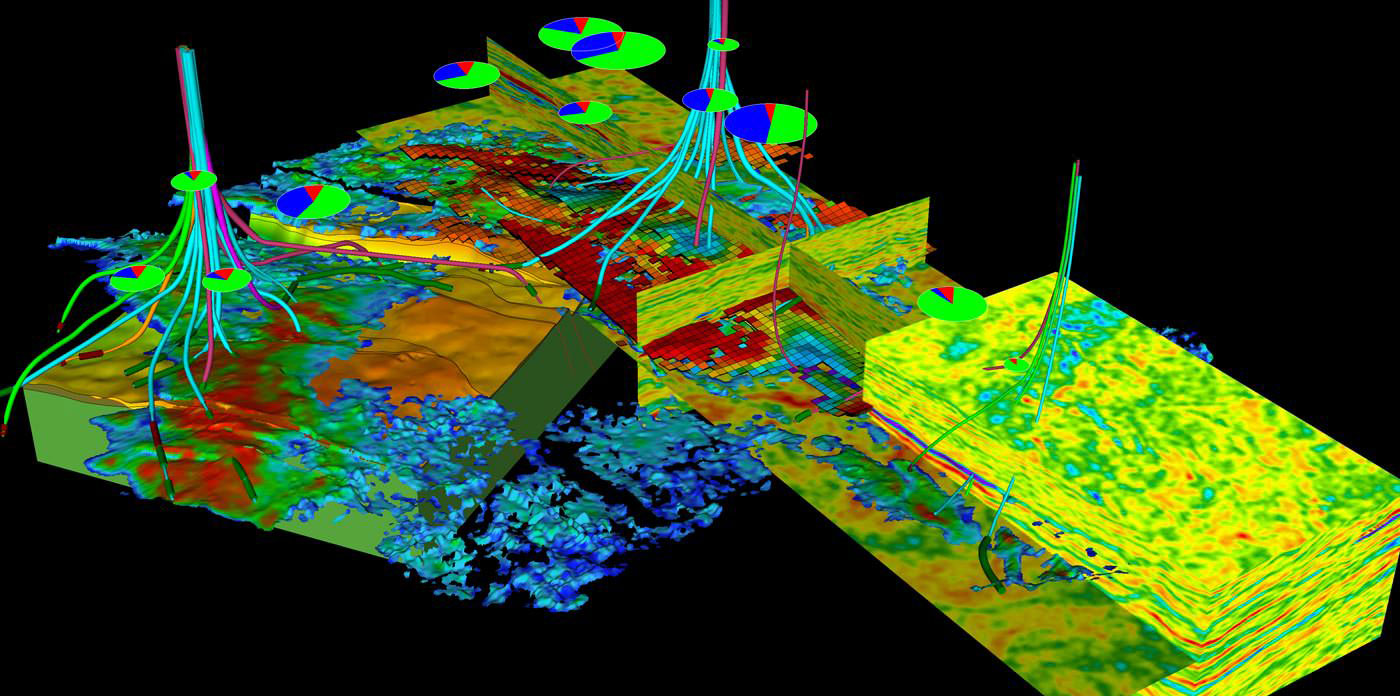
High-resolution prediction of "Sweet Spot" in tight thin reservoirs
Work difficulties:
• The pore types of reservoirs in this area are mainly residual intergrares pores and dissolution pores, which are ultra-low pores and low-permeability reservoirs;
• The main reservoir in this area is a thin sand layer. The reservoir has great horizontal variation. The distribution range and thickness of the sand body are difficult to be characterized;
• The vertical oil-water relationship in this area is complex, and the reservoir types are mainly lithologic reservoirs and tectonic-lithological reservoirs;
• The logging data in this area are poor and the logging curve distortion is serious. The natural gamma curve shows the vertical and horizontal trend of mudstone, which affects the reservoir identification and clay content calculation, etc., and the change characteristics of reservoir lithology and physical properties mask the influence of resistivity on fluid difference.
Technological Innovation Point 1 - Multi-well Consistency Trend Baseline Method Guides Single-Well Environmental Correction:
Multi-well logging data consistency check is an important quality control link in the seismic constraint inversion of well calibration. Due to the possible systematic errors of different series of logging instruments, the difference in the performance of the mud used in each well, and the influence of the wellbore, there are great differences between the different wells affected by the above factors. The logging and measurement environment in this area is poor and many wells have collapsed seriously in the mudstone marker layer section. It is impossible to obtain sufficiently stable sample points for fitting correction on a single well. It is necessary to use multi-well sample points for fitting.
Through the histogram statistical method and multi-well consistency processing. In the process of processing, the wells with significant system deviation should be removed. The remaining multi-well for comprehensive histogram statistics, the comprehensive statistical histogram should be used as the standard and remove other well system deviations. When it returns to the comprehensive histogram area, the consistency processing ends.
Technological Innovation Point 2—Saturation Calculation from Differential Formation Water Resistivity
Through the core analysis of the well, there is a difference between the water saturation parameters of the aquifer and the oil aquifer logging evaluation in the area, and the oil and water layers need to be qualitatively distinguished before the reservoir water saturation parameters are evaluated. It is assumed that the response characteristics of the resistivity curve are affected by the combination of lithology, physical properties and oil-bearing properties. The influence of lithology and physical properties is far greater than the influence of fluid, and the relationship between resistivity RD and lithological clay content curve VClay and physical porosity curve PHIT is established. The RD_syn of fitted resistivity is obtained. The resistivity curve is independent of the fluid. If there is a positive difference between the measured resistivity RD and the fitted resistivity RD_syn, the reservoir contains oil. Otherwise it contains water. On this basis, the water saturation calculation of the oil aquifer and the aquifer using their corresponding rock electrical parameters is used, and the calculation results are highly consistent with the saturation of the core analysis.
Technological Innovation Point 3— Technological Innovation of Well Constrained Lithology and Geostatistical Parameter Constrained Elasticity:
Combined with the overall research ideas of this project, the project team first obtained the lithological probabilistic body according to the distribution of net sandstone statistics at the well point, combined with the acoustic impedance data body obtained by the petrophysical interpretation template and the deterministic inversion after stacking, which laid the foundation for the subsequent co-simulation of porosity, permeability and other parameters of the sandstone data point by combining the lithological body and the high-resolution acoustic impedance data body.
The modeling results of the workflow of the general geostatistics modeling method lack the necessary quality control, but only realize the local optimal solution of the model based on the statistical algorithm, and the process of geostatistics inversion adds the comparison and optimization process of the recorded seismic data and the synthetic seismic, making full use of the predictability of the seismic in the horizontal direction to achieve the global optimization solution of the model results.
Results achieved: the coincidence rate of the sand layer of the old well reached more than 90% and the coincidence rate of the sand layer of the new drilled wells reached more than 83%


